


Workflow SOPs
-
Basic Analytics Dashboard Navigation
Step 1. Select Hostname(s)
After accessing the basic analytics dashboard that represents all DU website data by default, you might want to select some specific website(s)/page(s) and see the data only for that selection.
-
Go to the drop-down menu under “Hostname” and start typing your website’s domain/hostname.
-
Checkmark all needed website(s)/page(s) and press “Enter” (see Figure 1).
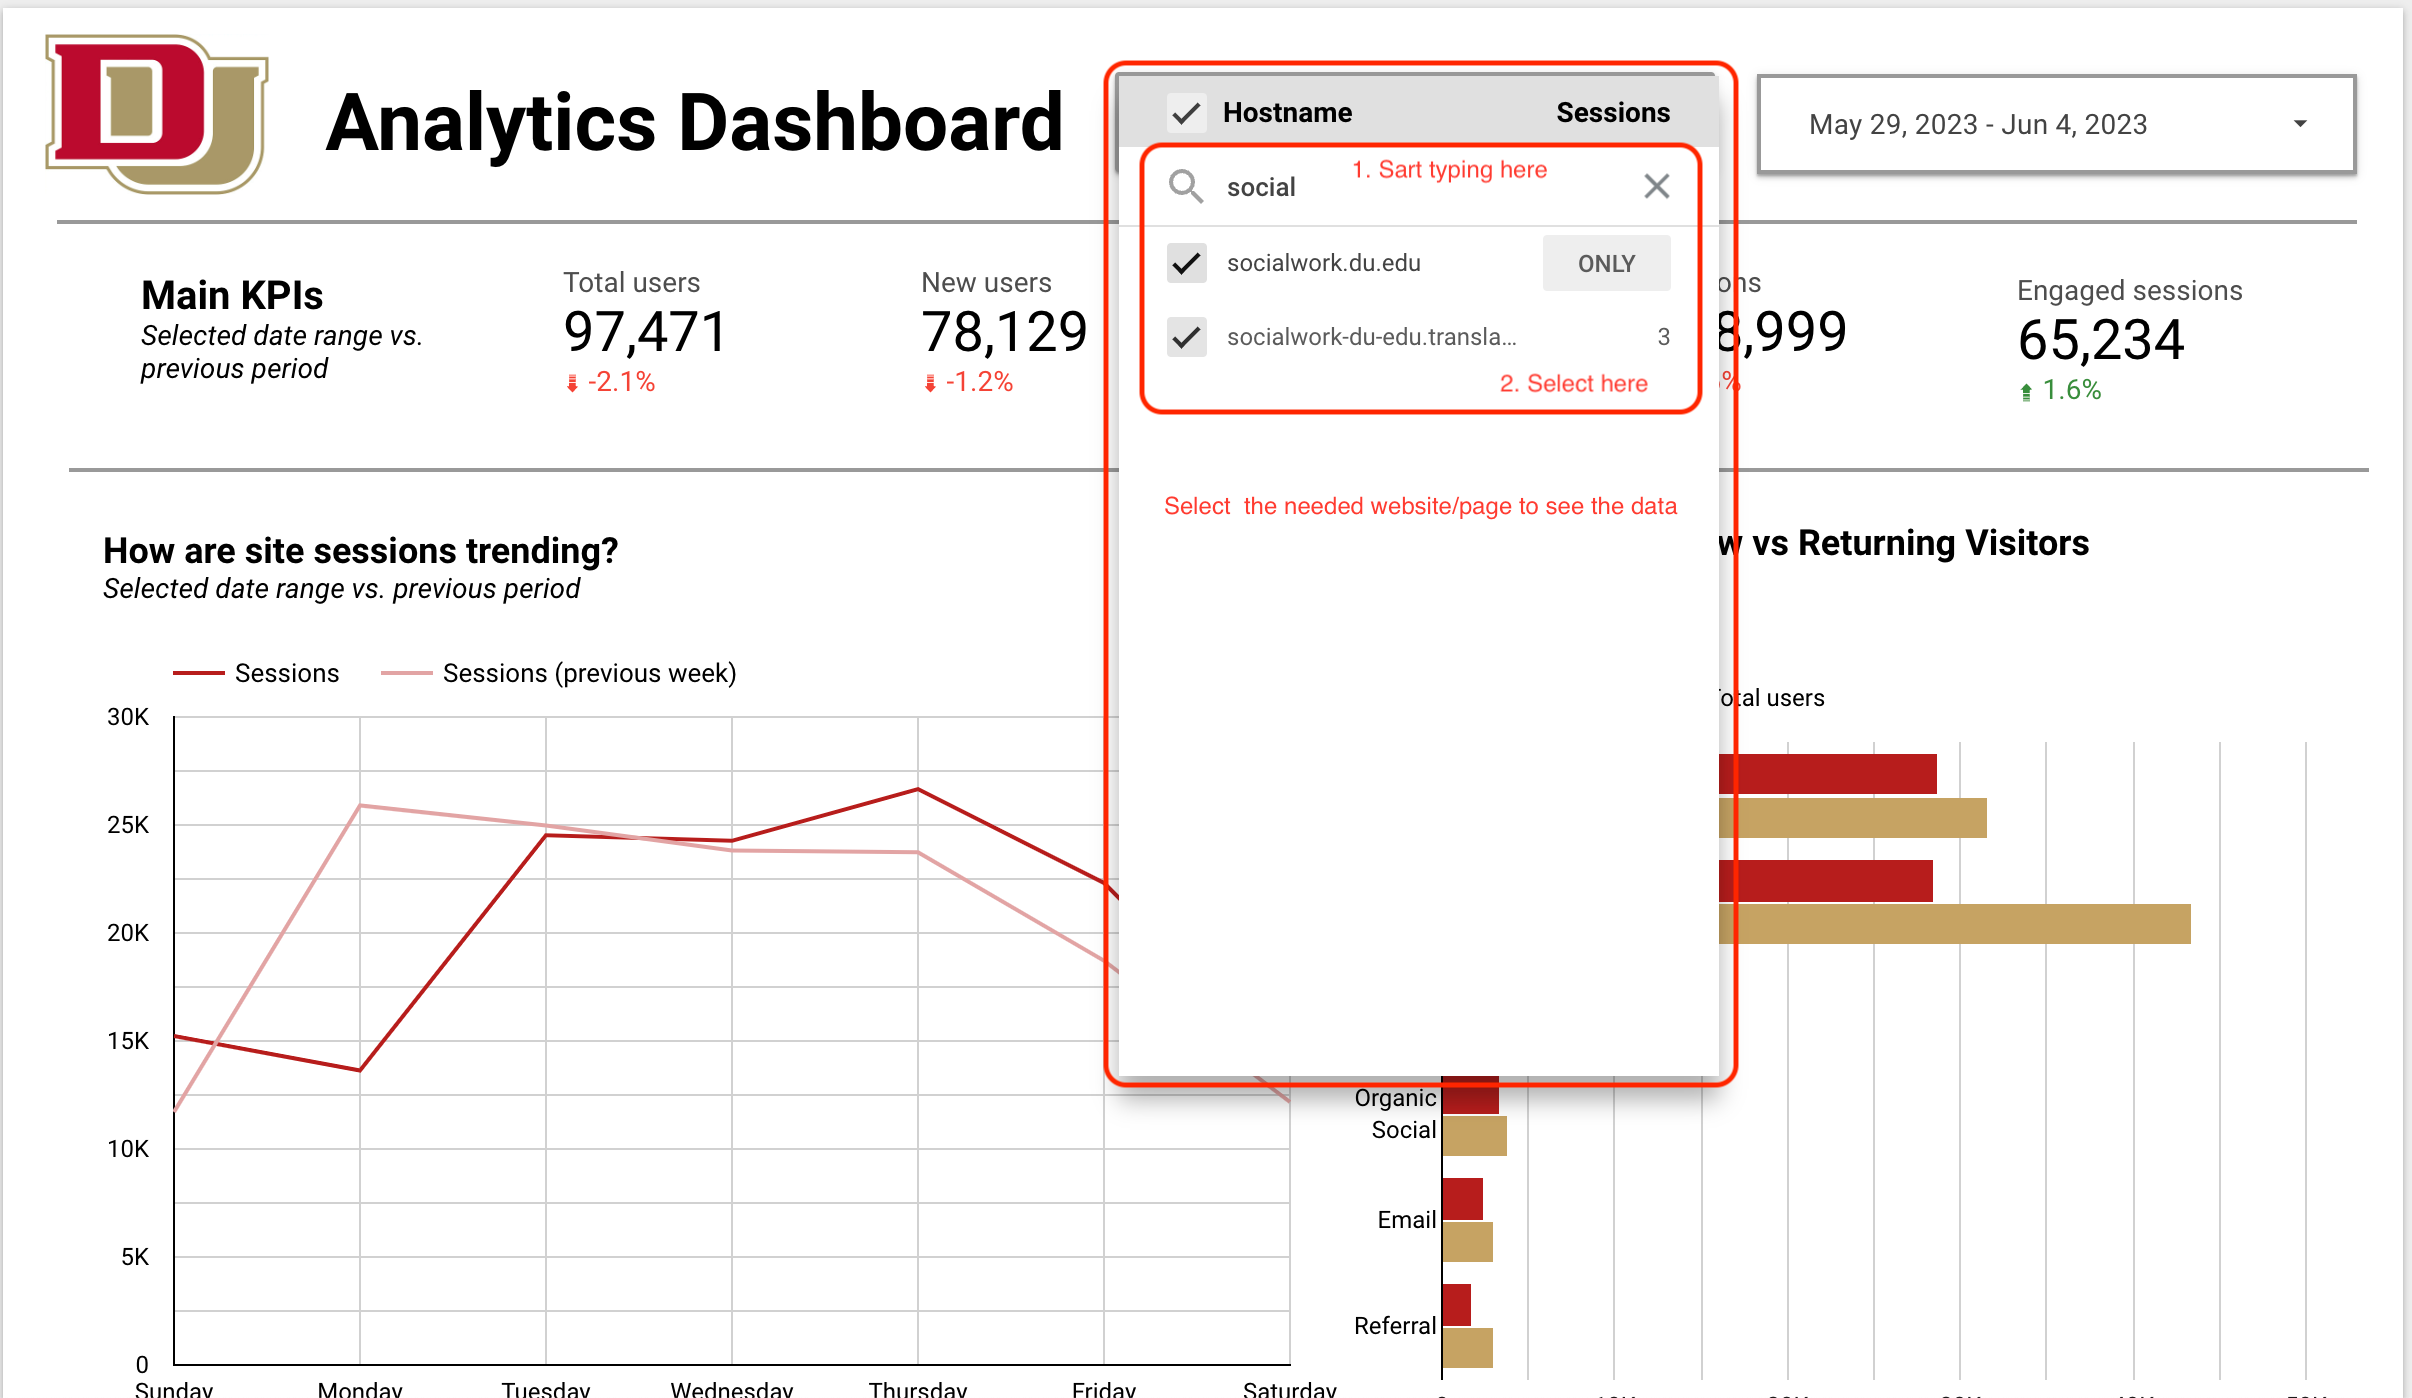
Figure 1. Select specific website(s)/page(s).
Step 2. Select Dates
The dashboard is set to represent data for the current week in comparison with the past week, which allows you to monitor the website performance with weekly updates. You can also select a desired time range to get data from previous weeks/months:
-
Go to the date drop-down menu and select the desired time frame (see Figure 2).
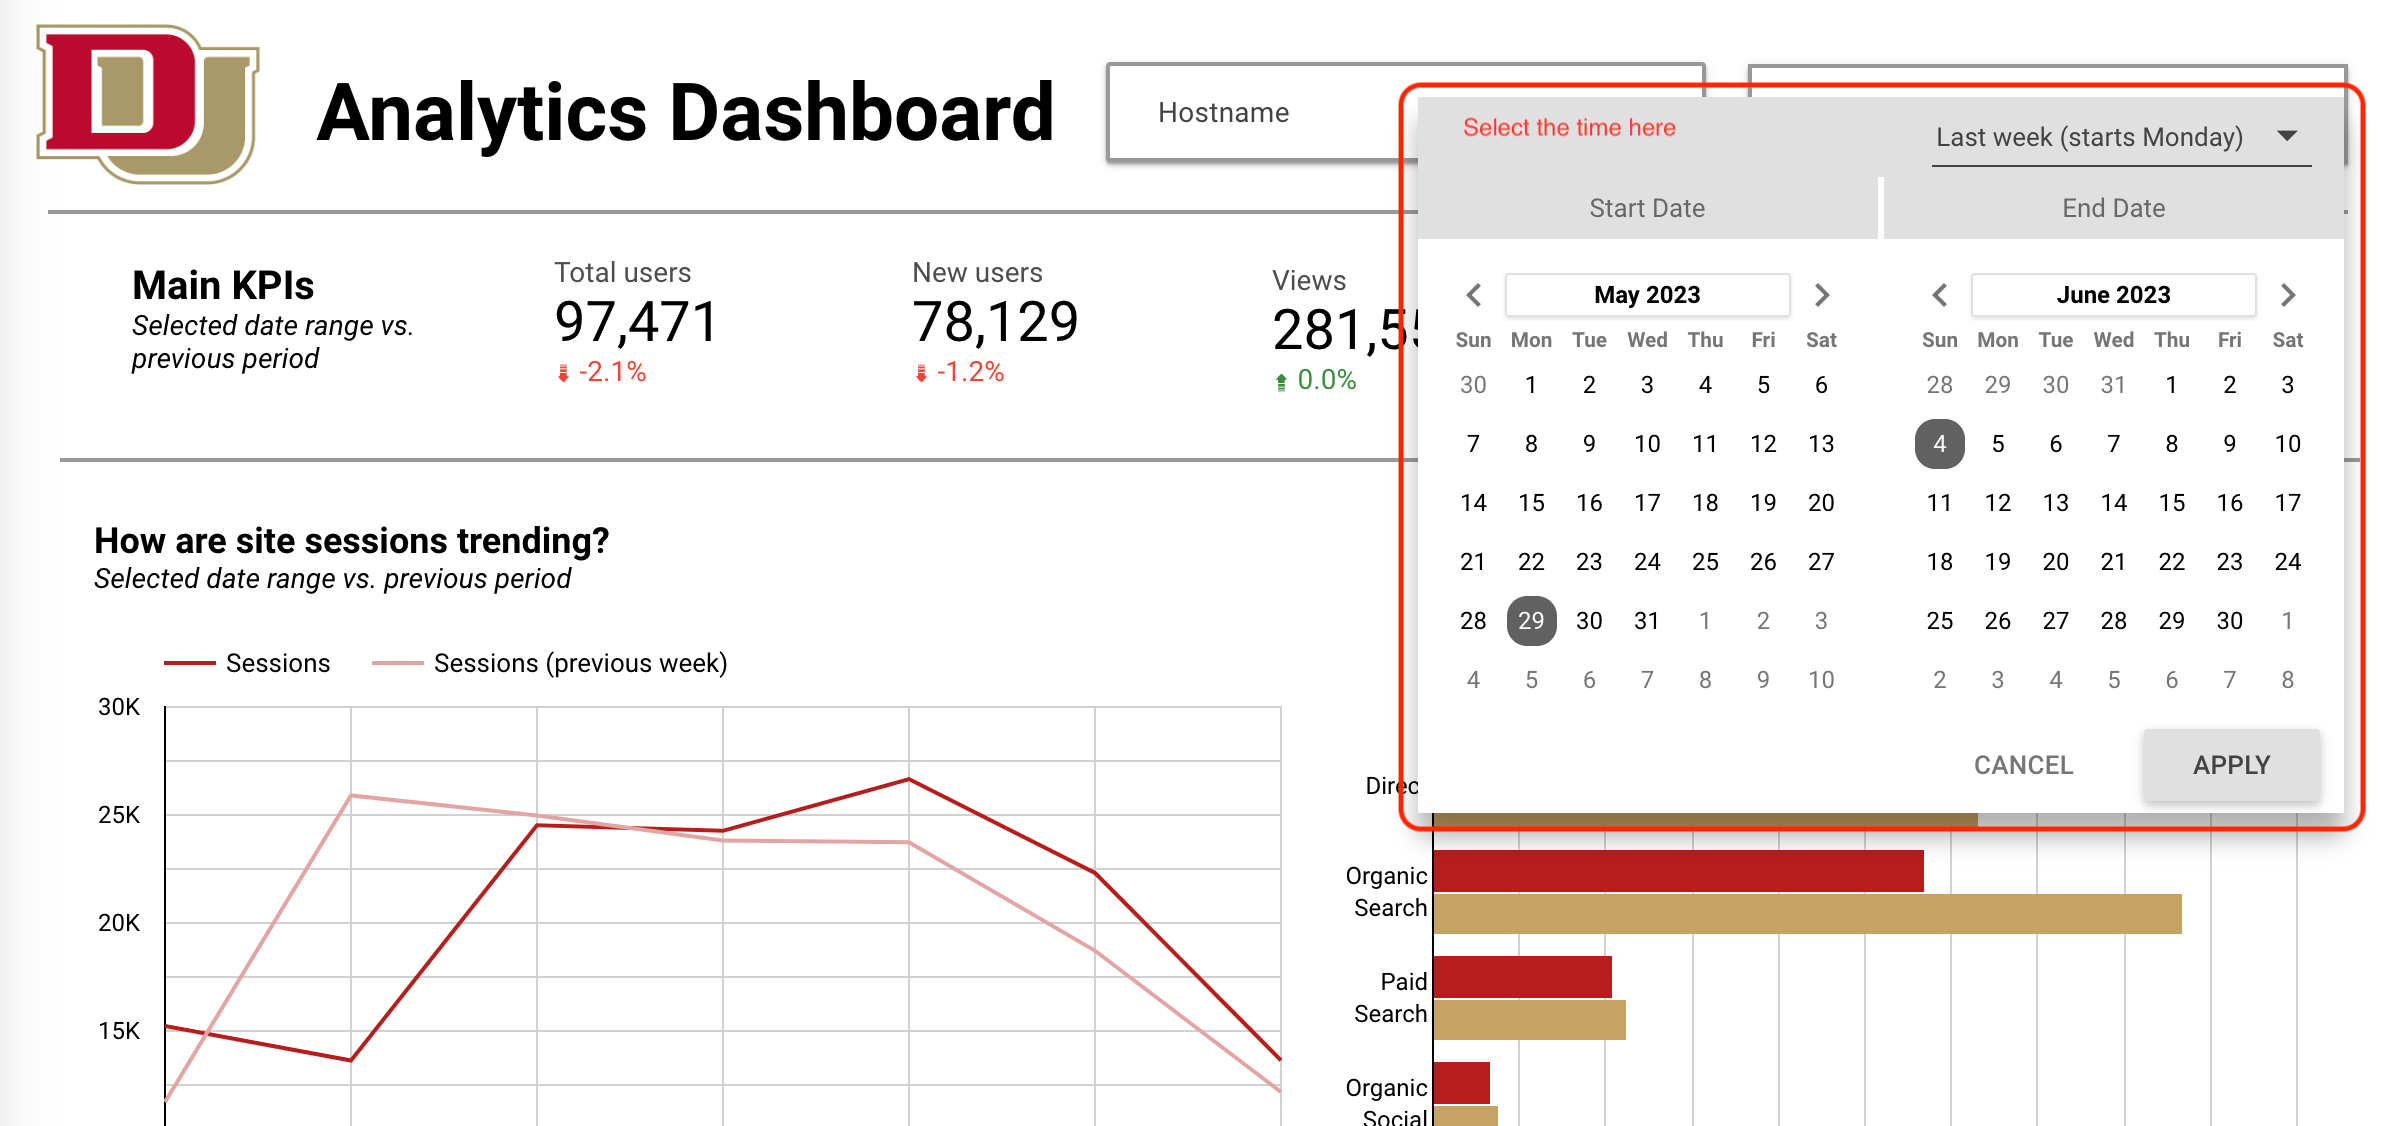
Figure 2. Select the timeframe.
Step 3. Select Campaigns
If you have campaigns (UTMs) set up, you can also view data for specific ones on the dashboard:
-
Go to the drop-down menu under “Session Campaigns.”
-
Start typing the source/medium/name of your campaign.
-
Check the ones you want to see (see Figure 3).
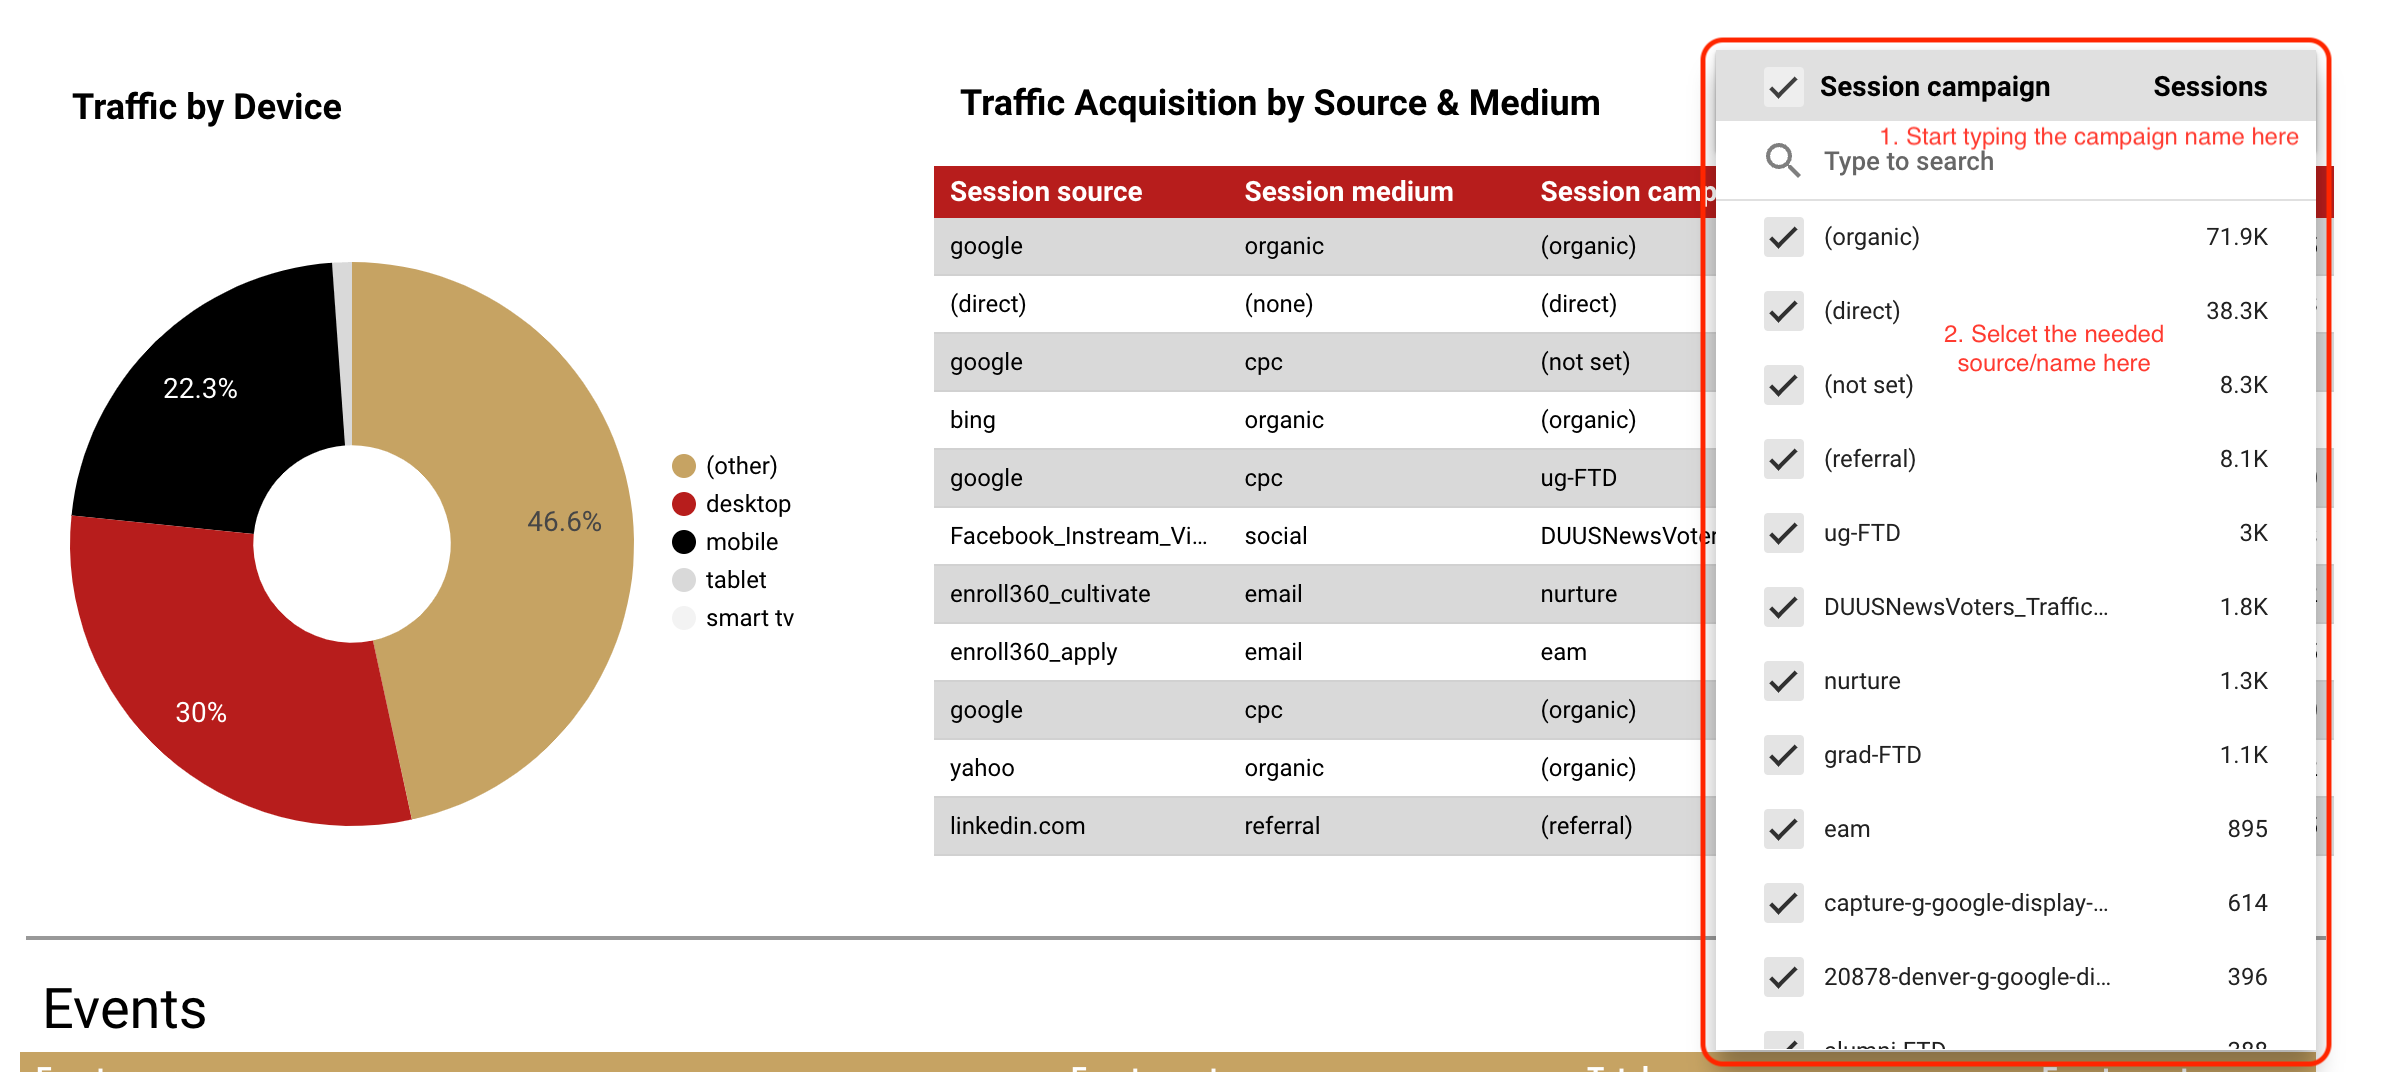
Figure 3. Select campaigns.
Step 4. Select Specific Webpage
If you want to check web traffic for the individual webpage(s), you can also view data for them on the dashboard:
-
Go to the drop-down menu under “Full page URL.”
-
Start typing the URL of your webpage.
-
Check the ones you want to see (see Figure 4).
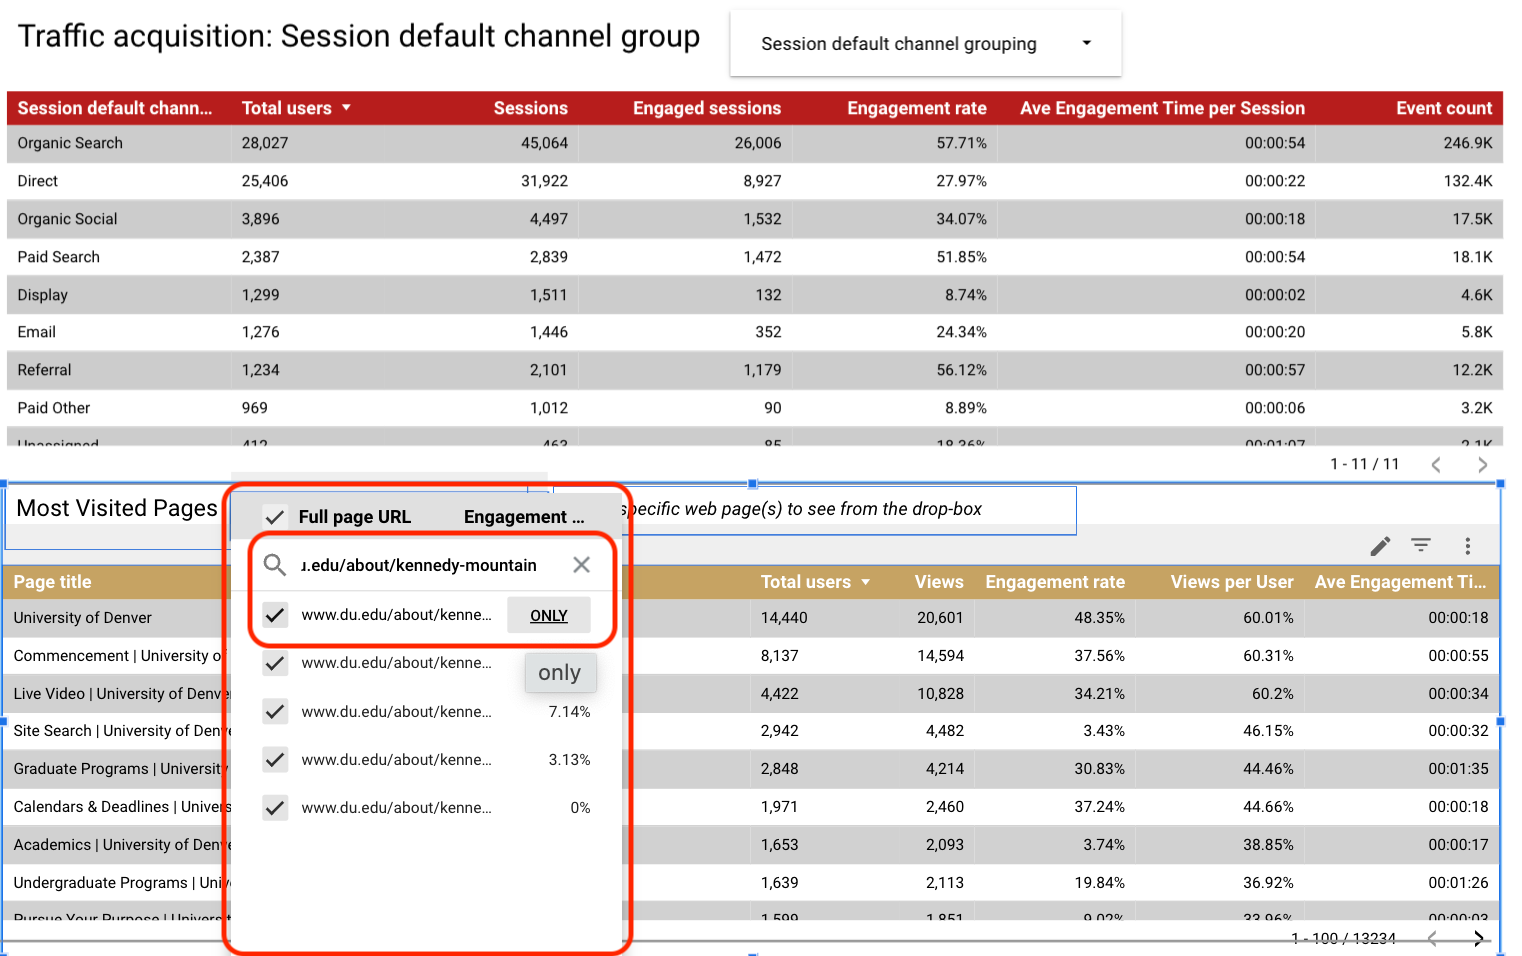
Figure 4. Select the webpage.
-
-
GA4 Navigation
Located on the left side, the main navigation offers access to essential features. Here, you'll find the Home, Reports, Explore and Advertising tabs (see Figure 1).
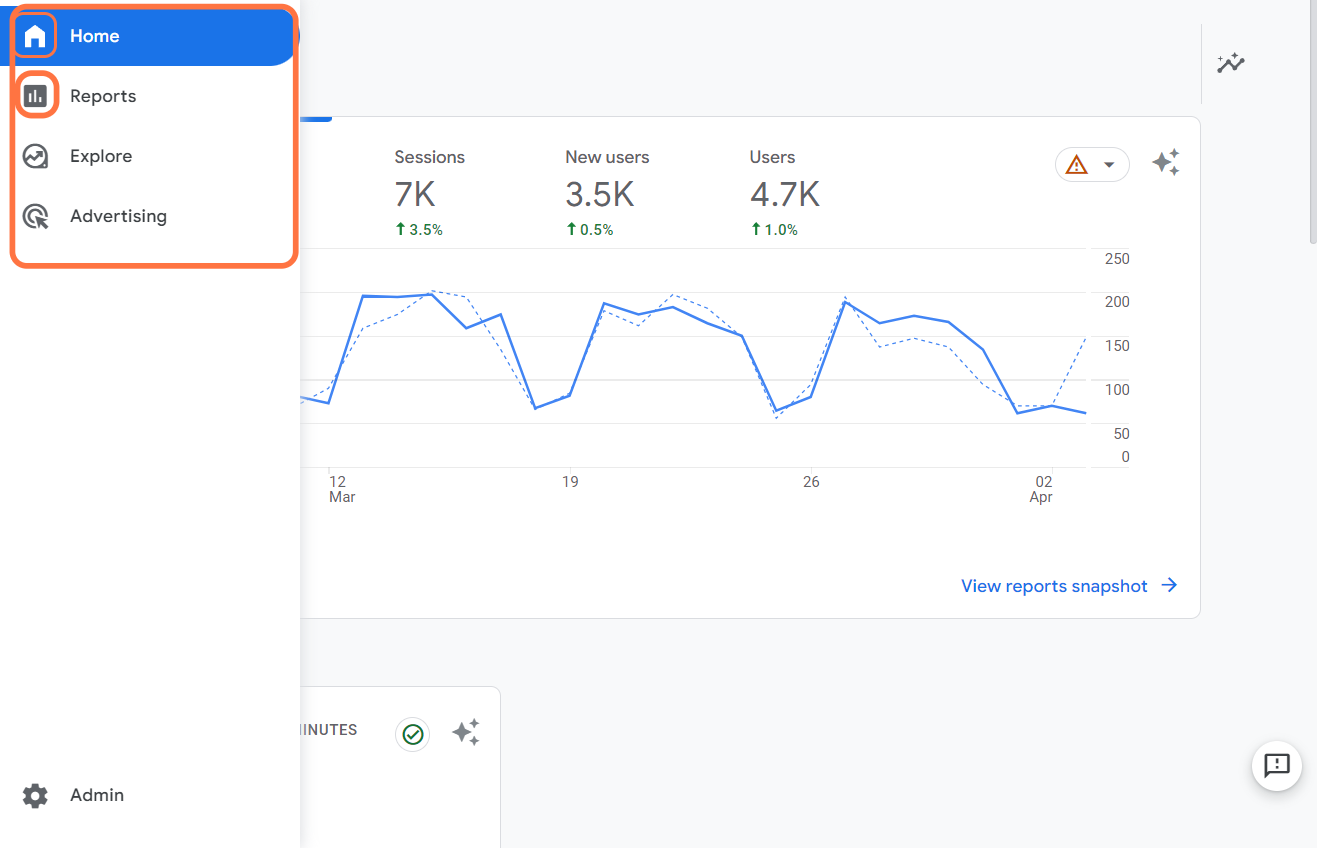
Figure 1. Main GA4 navbar.
To get faster access to your website data, go to the Explore tab to craft your custom mini-data GA4 reports, including selected data metrics, dimensions and visualizations (see Figure 2).
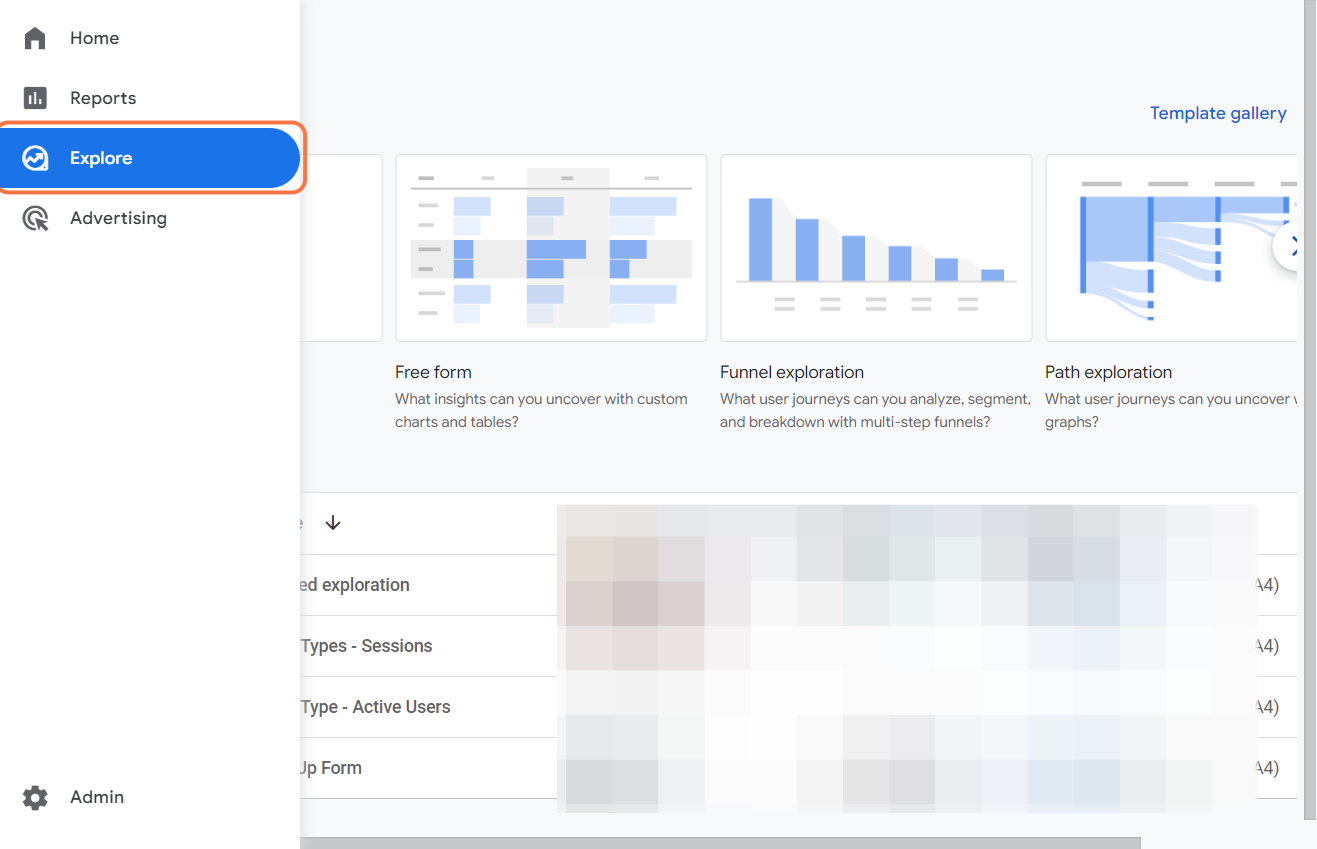
Figure 2. Explore tab.
Next, choose from different templates in the gallery, such as funnel analysis, path analysis, segment overlap, cohort analysis, etc. (see Figure 3).
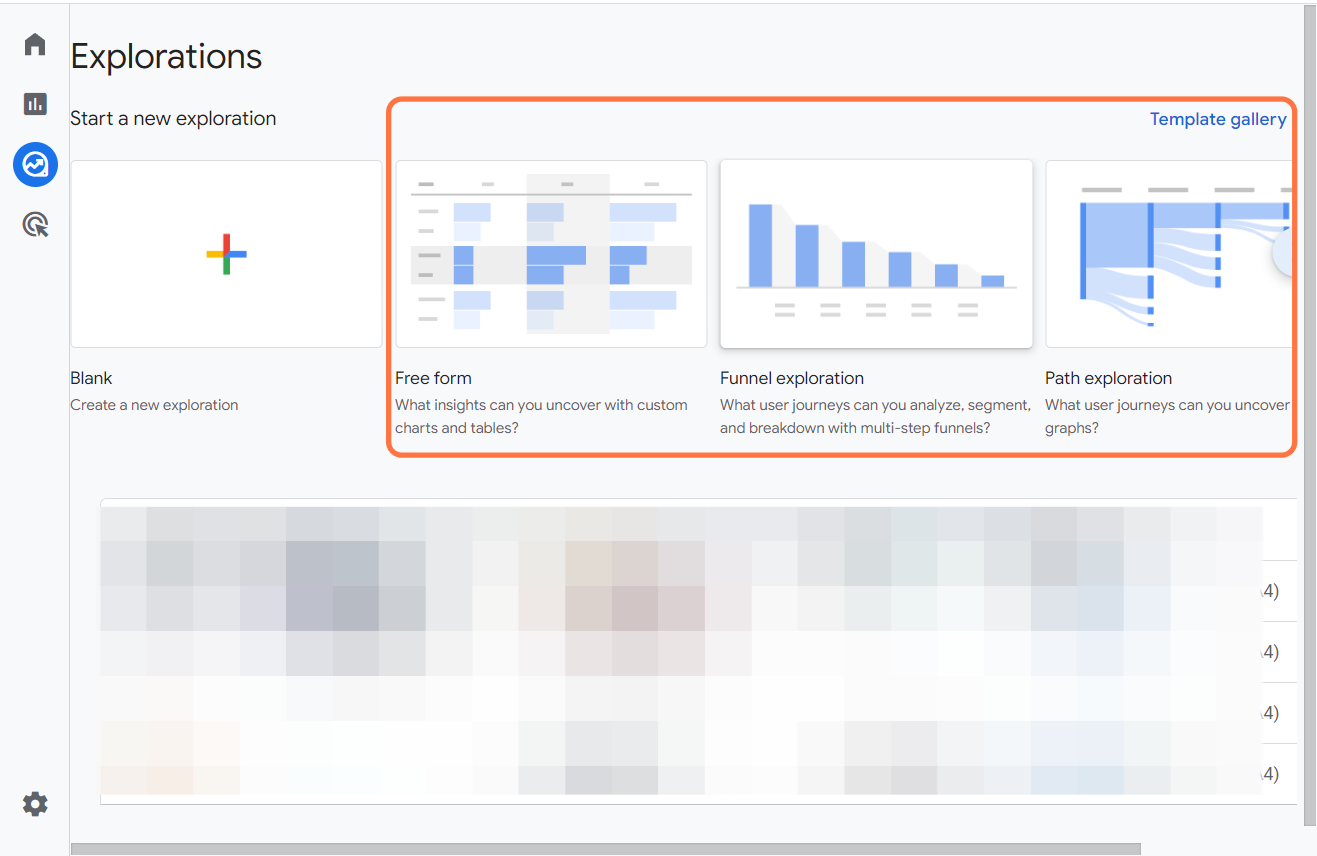
Figure 3. Explorations.
The most efficient way to get the data you want is to start from scratch and build your own report using various charts and tables within a “Blank” or “Free form” template (see Figure 4).
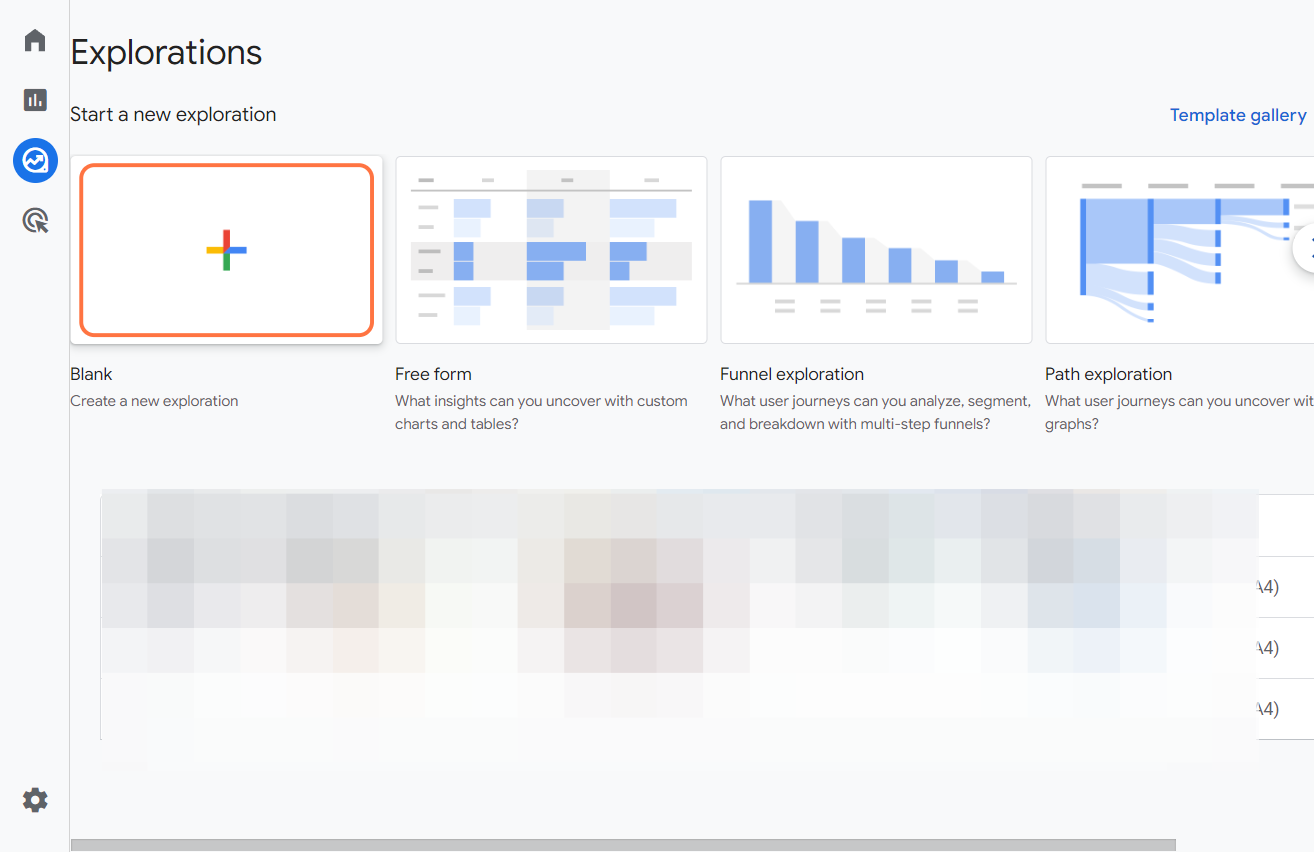
Figure 4. Blank template in Explorations.
Here, you can apply filters, segments and comparisons to drill down into the details and uncover insights for specific webpages (see Figure 5).
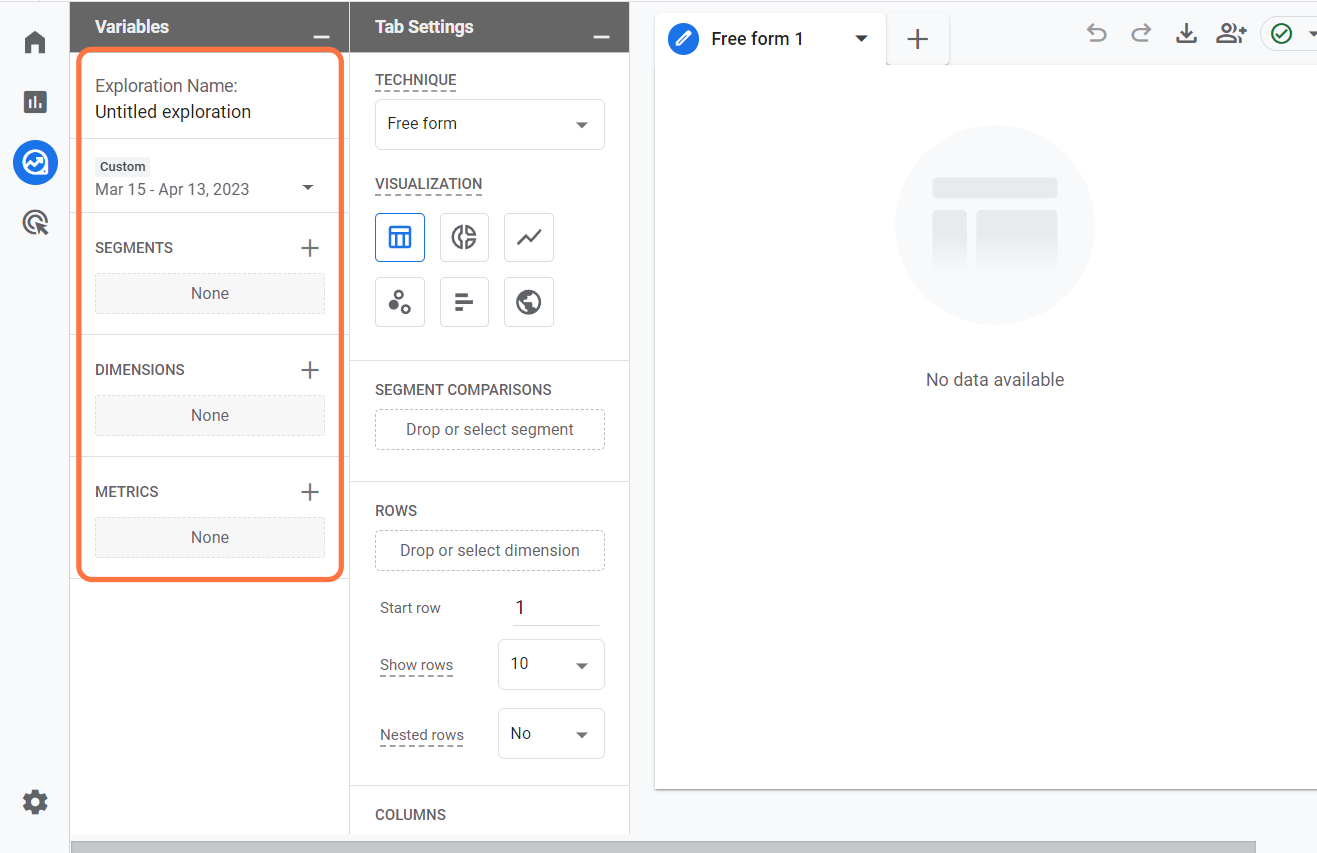
Figure 5. Choose variables in the “Blank” template.
Note: Explorations can help you fetch and see your data to understand:
-
How users interact with your website/app;
-
What actions they take; and
-
What outcomes they achieve.
-
-
Step-by-Step Guide for Creating Your Report
Step 1. Choose an analysis technique (template), for example, “Free form” (see Figure 1).
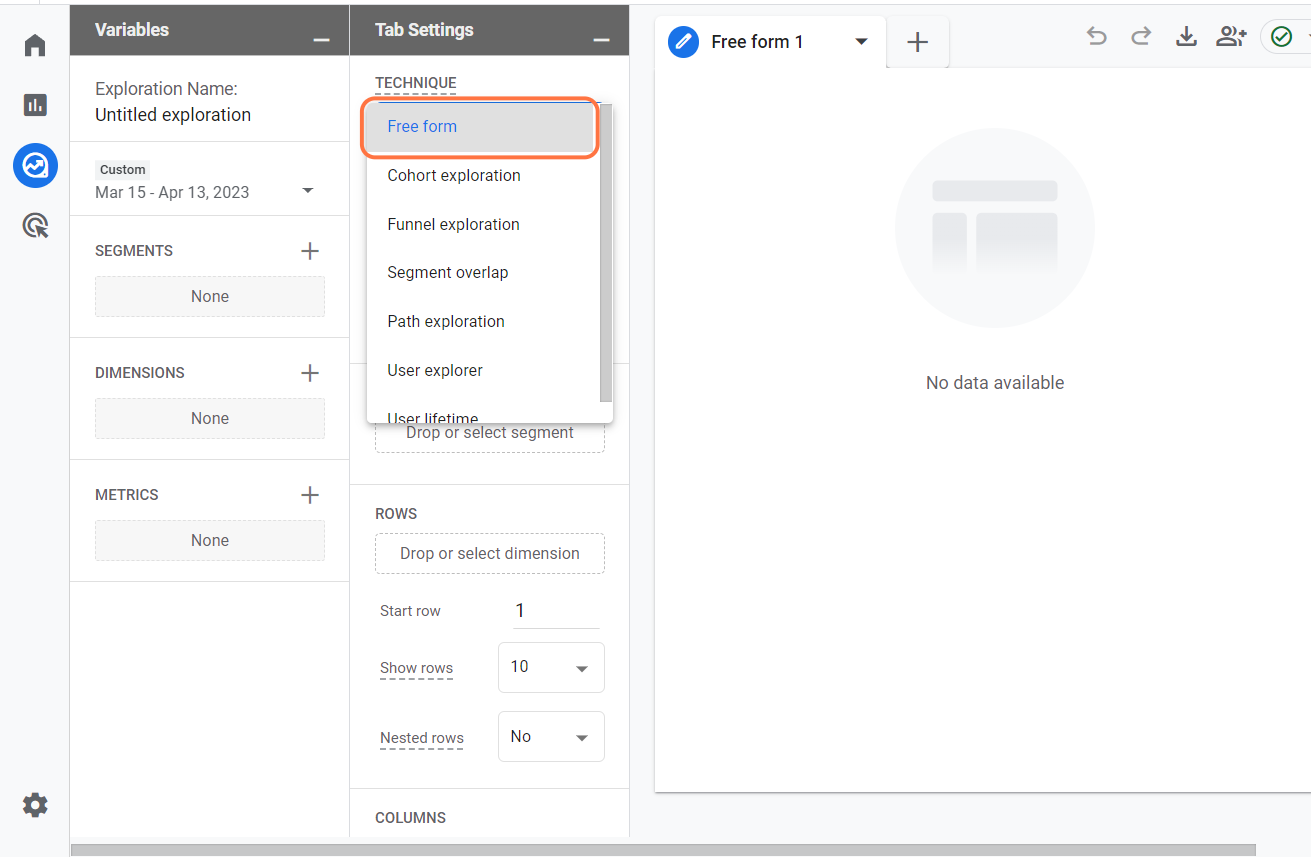
Figure 1. Choose a technique.
Step 2. Configure your report settings.
Next, name your report, set a time period and add dimensions with metrics. Don’t forget to apply filters (like “Hostname” to see only web performance for your particular website and pages) (see Figure 2). After selecting “Hostname” in the “Filters” section, choose “Contains” and enter your hostname (e.g., www.daniels.du.edu/) (see Figure 3).
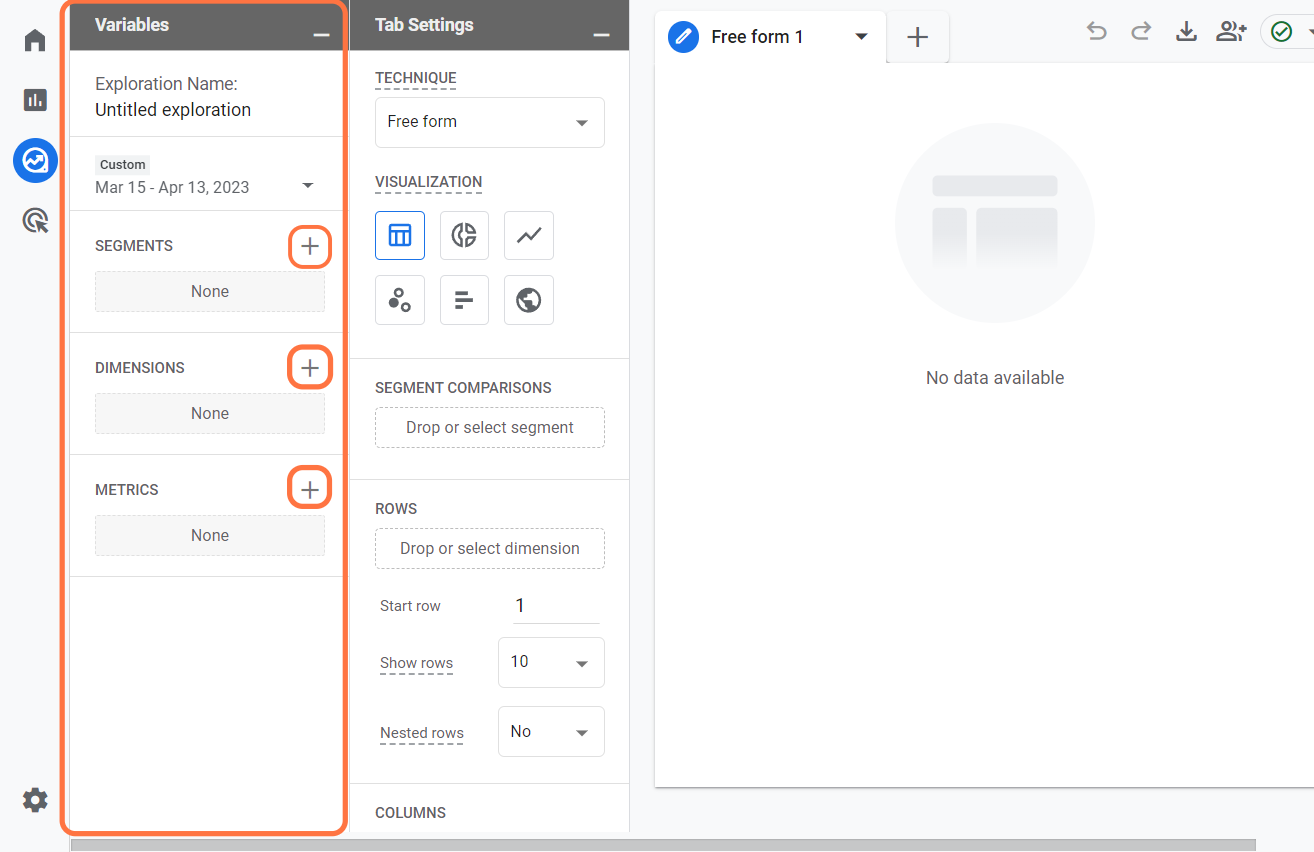
Figure 2. Report settings.
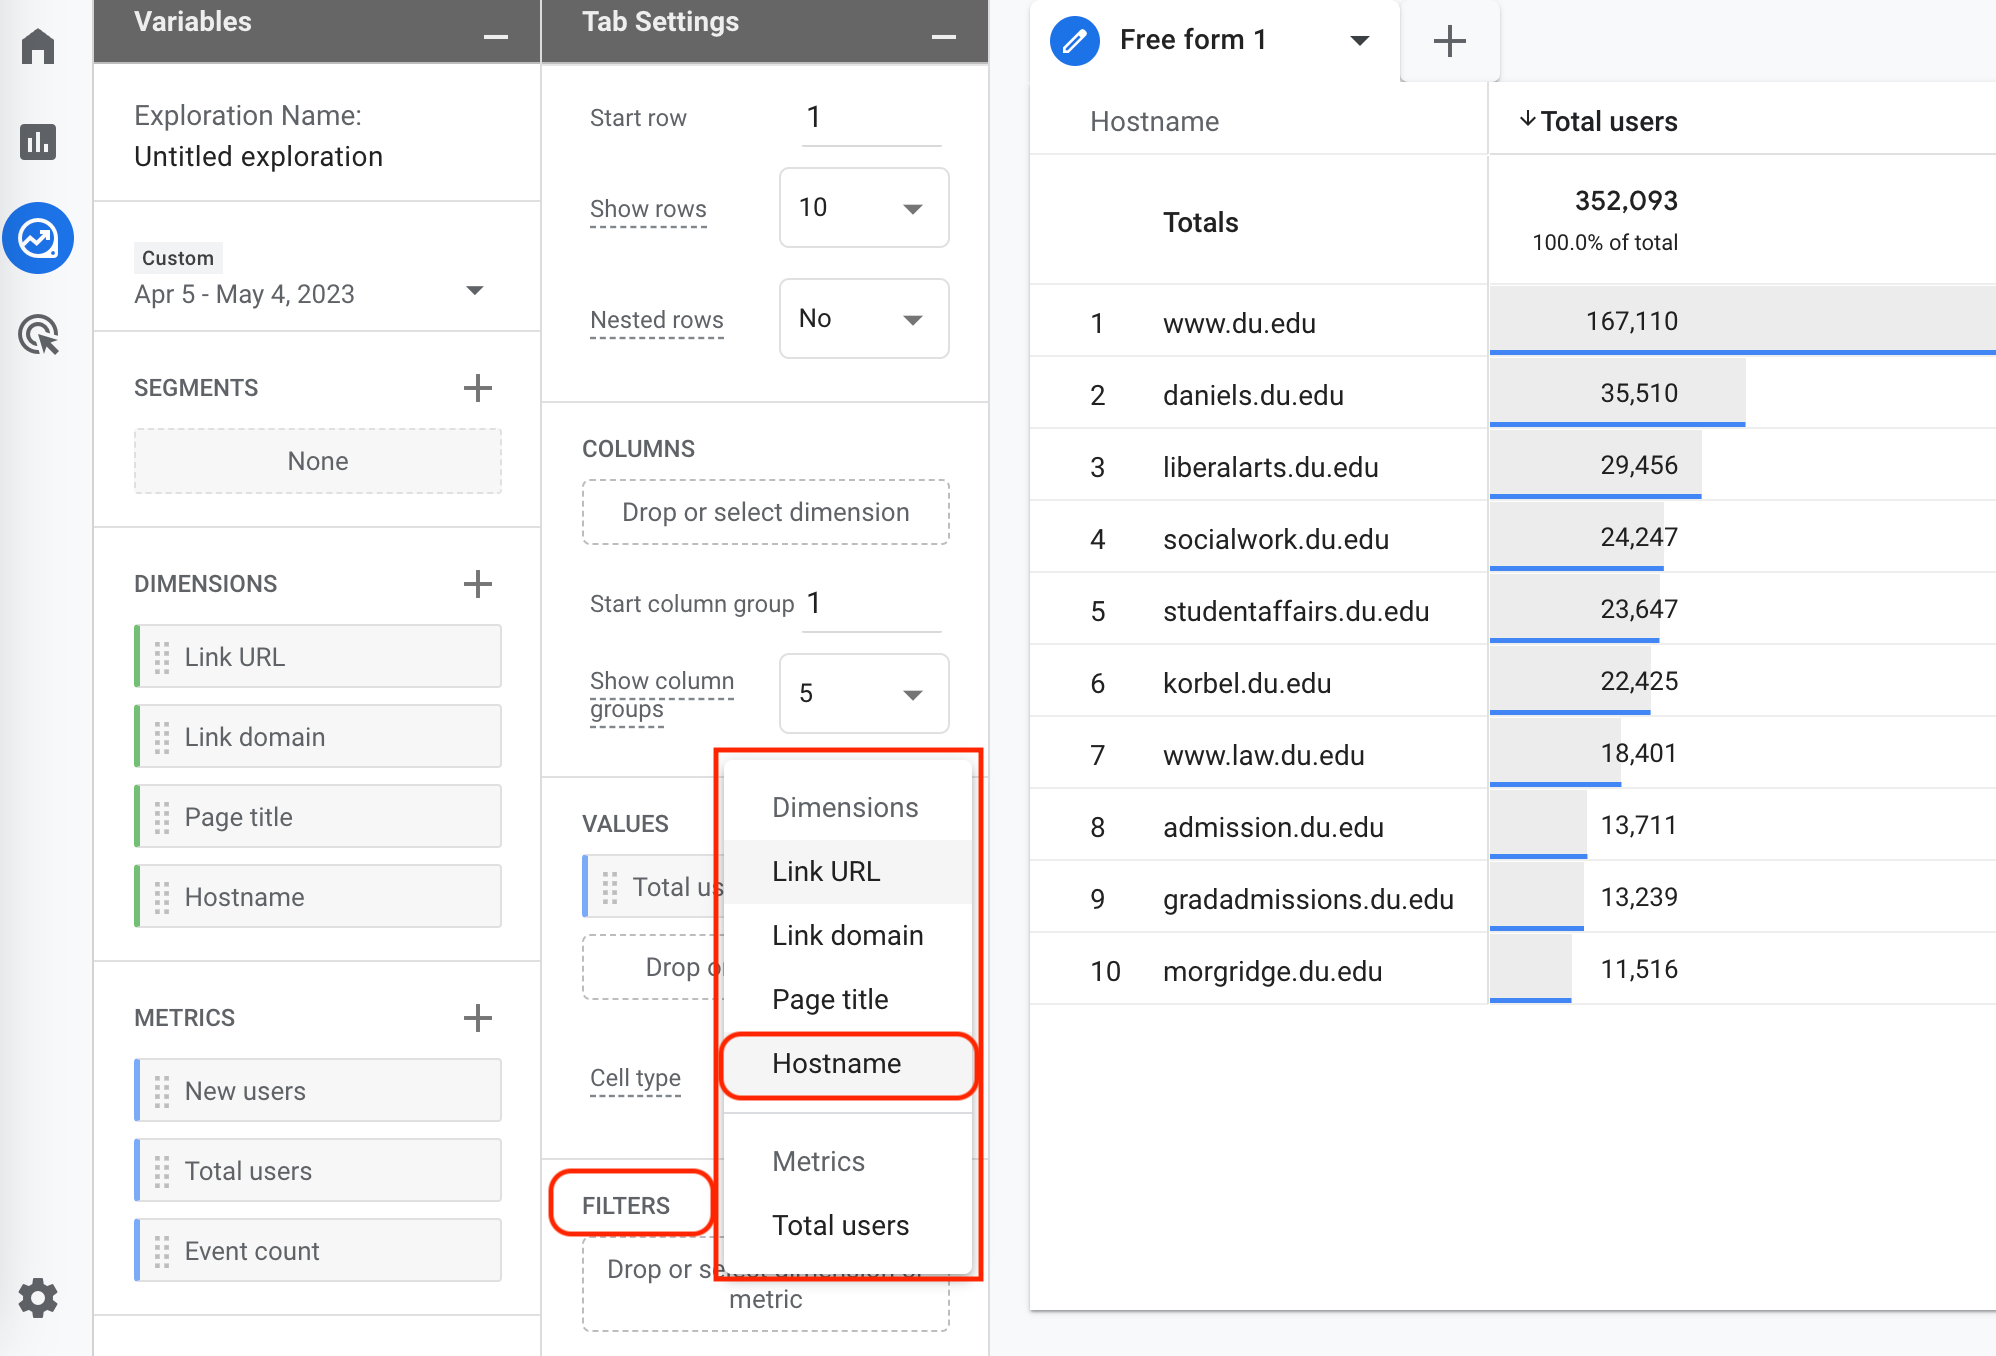
Figure 3. Filter settings.
Step 3. Select components.
After having selected dimensions and metrics, simply drag each component to the corresponding blocks (see Figure 4).
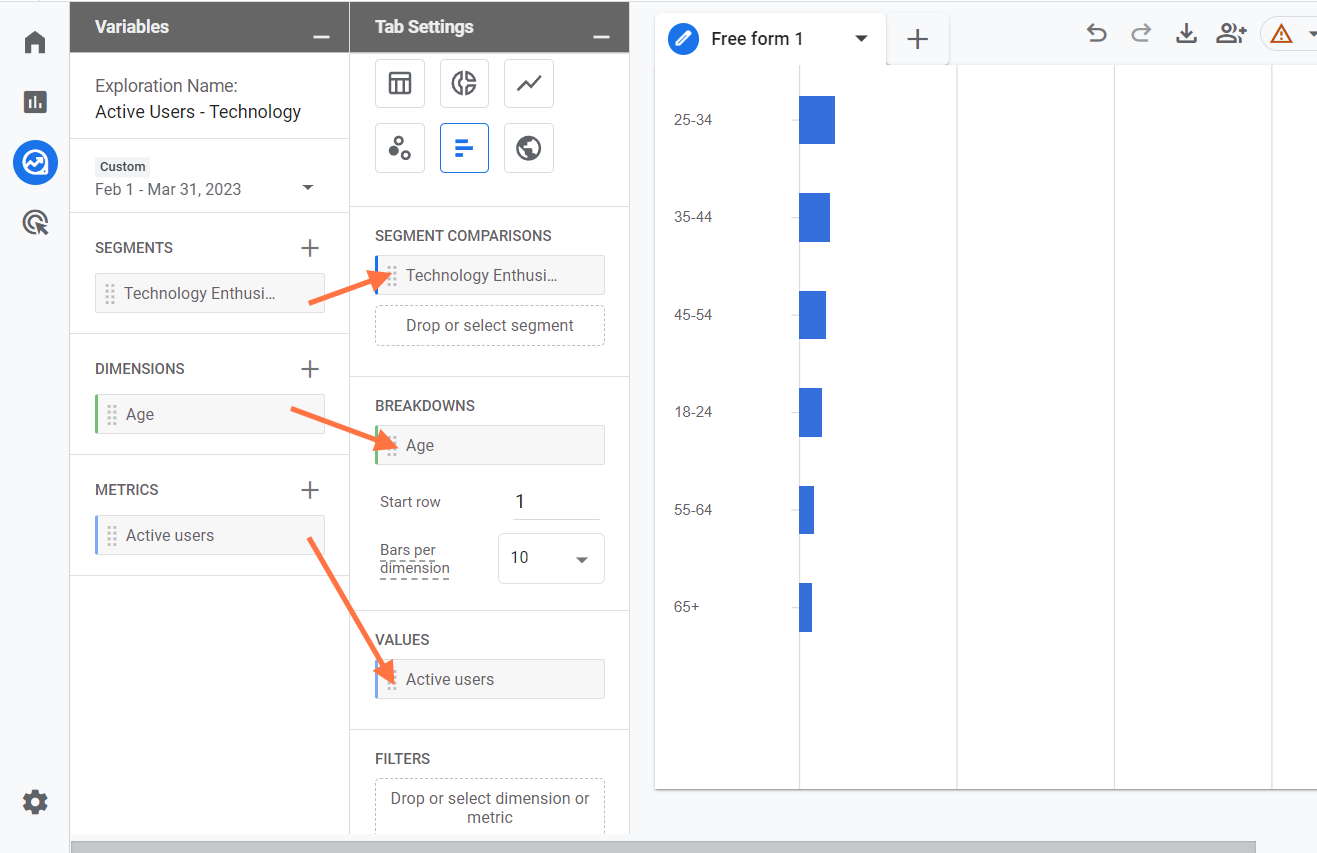
Figure 4. Dragging the components.
Step 4. Customize your report layout and available visualization options.
The GA4 interface allows you to simplify your reports with visualization tools (see Figure 5).
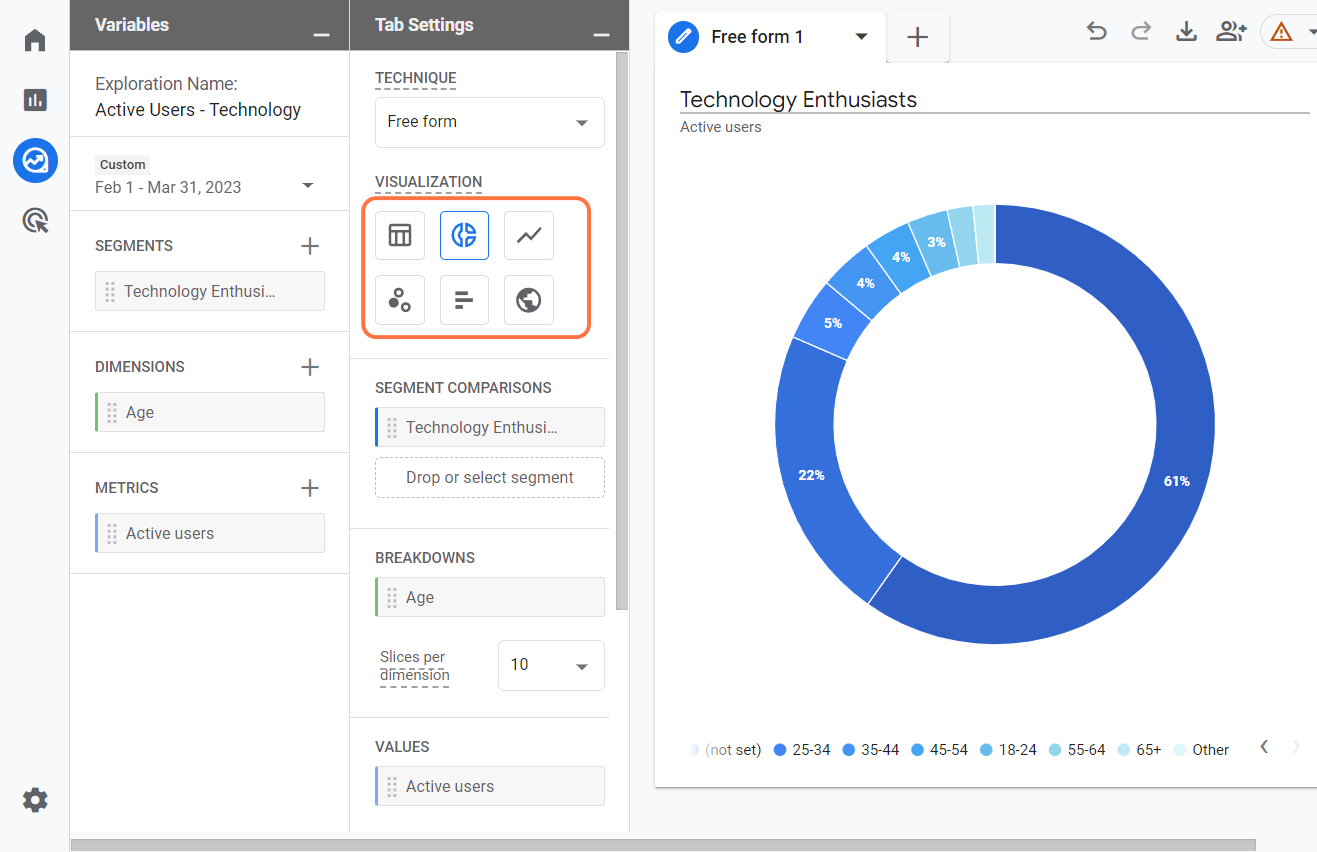
Figure 5. Report visualization.
Step 5. You’re done! There's no save button.
You can locate your report on the Explorations page to use it again in the future or make any changes (see Figure 6).
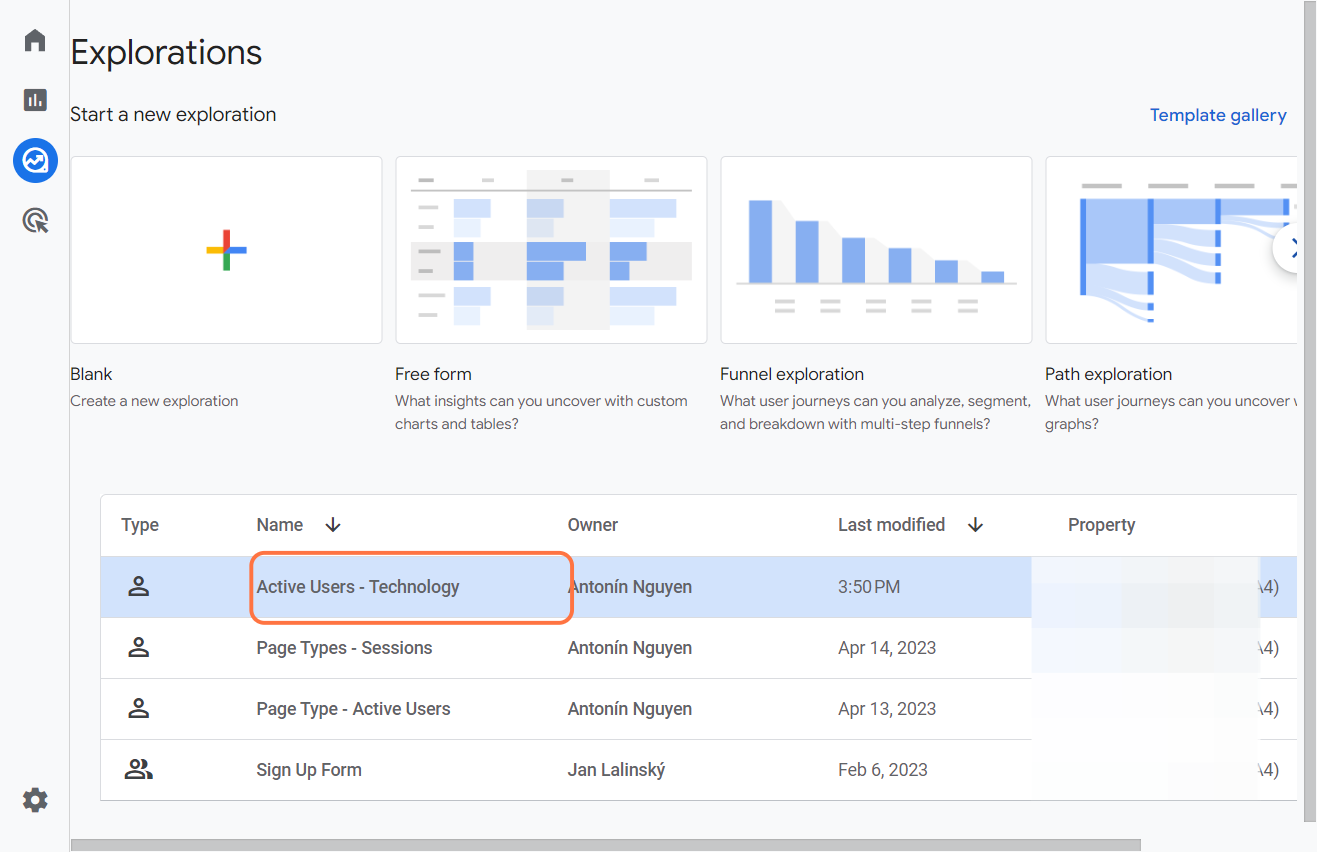
Figure 6. Saved reports in Explorations.